I'm Nicholas Tavares, a graduate mathematician who builds research code that gets validated and infrastructure that runs itself.
An early warning for the moment diversification quietly stops working. A from-scratch autodiff engine. A deliberation protocol for panels of language models. Short films made of math. Phonk written in Python. A deckbuilder about rigging slot machines. It all connects, I promise.
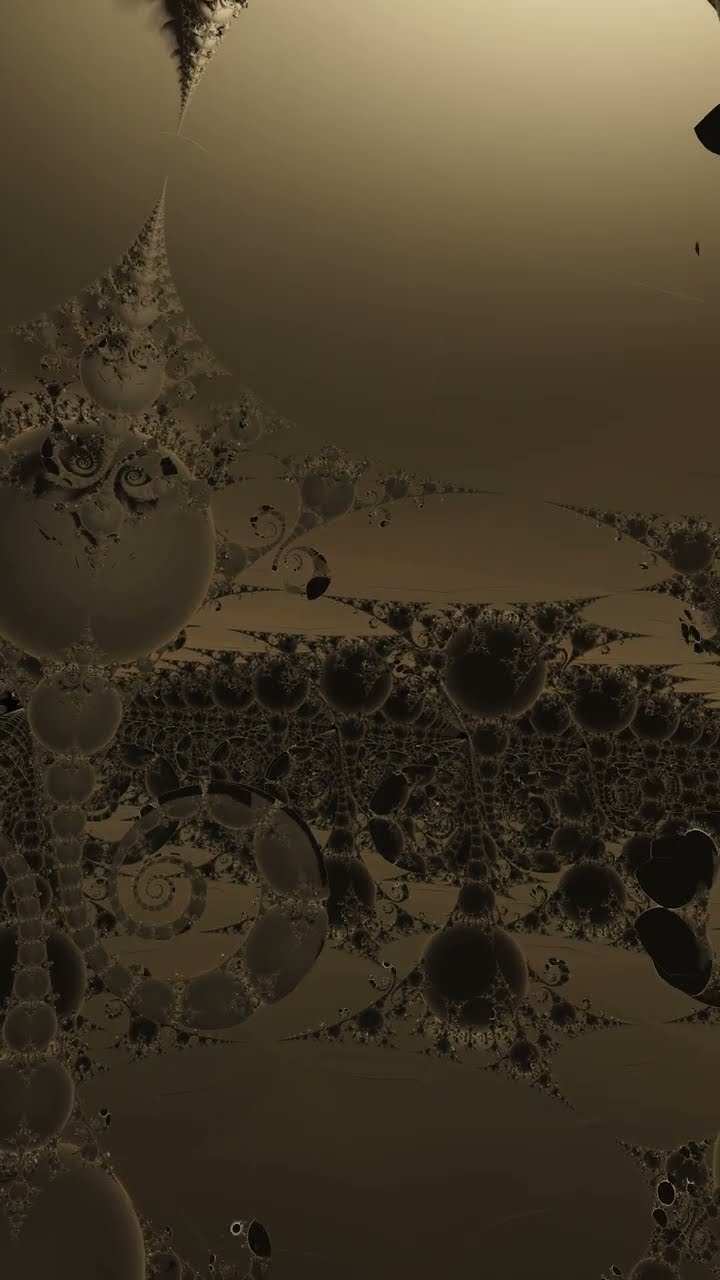
background: Julia set, z → z² + c, c orbiting the cardioid
rendered live on your GPU · little sibling of the Fractal Madness project
§ 1 · About
Where pure math meets messy data
I'm a mathematician and ML engineer who builds systems that find structure in chaos. My academic work sits at the intersection of graph theory, information theory, and network analysis, using tools from pure mathematics to study complex systems and multi-agent architectures.
I recently finished my M.S. in Mathematics. A lot of my research keeps circling one question: whether the network topology of markets genuinely reorganizes under macroeconomic stress, or whether that structure is mostly hindsight. It's an open problem, and it deserves rigor, not vibes.
The rest of my time goes to building. Lately that ranges from an automatic differentiation engine written from scratch to prove I understand the chain rule, to a deliberation protocol for panels of language models, to a raymarcher that renders 4D fractals in real time. I believe the best insights come from asking better questions, not running faster models.
Short version: personal site, academic work, nothing here tells you what to do with money.
Personal Site
This website is maintained in my personal capacity only. It is not affiliated with, endorsed by, or associated with any employer or financial institution. All views and opinions expressed here are my own and do not represent the views of any firm. For professional background, see my LinkedIn profile.
Not Investment Advice
Nothing on this site constitutes investment advice, a solicitation to buy or sell securities, or a recommendation of any investment product, strategy, or course of action. All content is for educational and academic research purposes only and should not be used as the basis for any investment decision.
Research Disclaimer
All research findings, statistical results, and quantitative analysis presented here are theoretical and academic in nature. Historical patterns observed in specific datasets do not predict future performance and have not been validated for real-world application. Past performance, whether simulated or backtested, does not indicate future results.
§ 3 · Research
The thesis
Working-paper research on the moment portfolio diversification quietly stops working.
Before the Correlation Moves: An Early Warning for Diversification Breakdown
N. Tavares, A. Hanini, B. DaSilva · Stevens Institute of Technology · 2025 to 2026
Diversification failure is usually diagnosed after the fact, once correlations have already converged. This paper asks whether the breakdown is visible earlier as a structural process: assets defecting between data-drawn clusters, and the dependence network changing shape before correlation levels and volatility confirm anything. We build rolling similarity networks over a 76-ETF multi-asset panel spanning 2010 to 2026, cluster each window with consensus Leiden detection, and track two structural measures, a Cluster Migration Index and a Topology Deformation Score, across eleven market stress episodes.
76ETF panel
16years of data
781rolling windows
11stress episodes
7pipeline stages
Figure 1. Weekly deformation score (Pearson-layer TDS, z-scored against a strictly past window), 2012 to 2026, drawn from the paper's results file. Shaded bands mark the studied stress episodes; the dashed rule at z = 1.5 is the alert threshold used in the event studies. The 2011 euro-crisis episode predates the first valid causal score. Hover for dates and values.
Key findings
The deformation score crossed its alert threshold 37 trading days before the 2022 Fed repricing and 8 before the October 2025 tariff shock, while volatility measures stayed quiet.
Surprise shocks are different: COVID gave no advance warning at all. The paper says so plainly instead of curve-fitting around it.
Out of sample and net of costs, a deformation-gated 60/40 de-risking rule kept 98 percent of the static portfolio's return at 83 percent of its volatility. Volatility gating never managed that on the same data.
Overlay parameters were frozen on 2012 to 2018 training data before any out-of-sample evaluation, and the tail-dependence variant that failed is disclosed in the appendix as tested and rejected.
† Academic research: every number above regenerates from a single results file produced by a pinned seven-stage analysis pipeline; if a claim is not in that file, it does not appear here. Findings come from a specific historical dataset, have not been validated for real-world application, and are not investment recommendations.
§ 4 · Projects
Things I've built
Research systems, open source libraries, agents, graphics, and one video game.
This list writes itself. A pipeline on my machine scans the local repos twice a day, pulls live git stats, runs a safety filter over every description, and republishes the JSON this page reads. New work shows up here when it's real, not when I remember to edit HTML.
§ 5 · Mathematics
The foundation
From abstract structures to applied algorithms.
§ 6 · Films
The math makes movies
Fractal films with original scores, and a comedy lane to keep things honest.
The raymarcher behind Fractal Madness is also a film camera. Point it at a Kleinian limit set or a brand-new fractal object, choreograph the flight path, and score it with a track from Phonk Lab: the result is a running catalog of short films about mathematical objects that deserve the nature-documentary treatment. Sound on. And because not everything has to be profound, the same channel carries a comedy lane of captioned animal shorts.
Plate I. Gold Reliquary: one unbroken dive through a Kleinian limit set.
Plate II. Tetrabrot: two Mandelbrot sets multiplied together.
Plate III. Comedy lane: the coworker who stays calm during every crisis.
Built an early-warning framework for diversification breakdown, with novel structural metrics (CMI, TDS) evaluated on a frozen-parameter, strictly out-of-sample design. Building multi-agent research systems along the way, and releasing open source as I go: a multi-model deliberation engine, a from-scratch autodiff library, and a forecast comparison toolkit.
Coursework in Machine Learning (CPE595), Applied Statistics (MA544), Time Series Analysis (MA641), Optimization & Stochastic Calculus (MA576), and Big Data Technologies (BIA678). Thesis on multi-asset network topology under macroeconomic stress, plus research projects that bridge academic rigor with working software.
LSTMSARIMAHMMSparkKafkaPostgreSQL
§ 8 · Contact
Get in touch
Open to academic research collaborations, quantitative mathematics discussions, and software engineering opportunities. If you're working on interesting problems at the intersection of mathematics and computation, I'm happy to connect.
Newsreader for text, JetBrains Mono for data, set in ink and printers red on warm paper. Dark pages use the same ink, inverted.
Engine
One hand-written HTML file. No framework, no template, no analytics. The cover is a single GLSL fragment shader your GPU runs live.
Data
The project ledger and its sparklines regenerate from local git history twice a day; Figure 1 regenerates from the paper's results file. Nothing on this page is typed in by hand twice.
Receipts
Zero rounded corners, zero stock illustrations, zero trackers, one shader. Both themes pass an automated contrast audit over every visible line of text.
Reading
Press / to jump anywhere, 1 through 9 for sections, ◐ for dark or light pages. It prints properly too; try it.
↑↓ navigate · enter select · esc close · keys 1–9 jump sections